Simulated surface crazing using a fragment shader
Let’s say we want to simulate the following: Tension inside a surface is very strong. Too strong: The surface breaks. Two fragments now. Still tension. More breaks. Four, eight, 16, 32 fragments now, still tension, more fragments…
From this process emerges a pattern of lines. Each line forms a boundary, rather than connecting two points, it delimits two areas of different tension. In passing, it tells a story about different material properties, and about the progression of time, and the irreversibility of some effects, and suggests something about underlaying causes.
The process is called crazing in pottery, and the patterns created are quite interesting. They remind of city street layouts in dense urban landscapes, clay which dried in an empty riverbed, or the surface of fallen leafs in autumn. The visual similarity suggests there is a common principle, a common process in its creation. A process that I wanted to simulate for a while, and I believe I found an approximation which is fairly elegant.

It’s clear that lines are the main design element. Lines that break shapes, and define new shapes. And so on.
Drawing good lines in computer graphics is hard. And to use these lines in simulation is even harder. At first I thought of different CPU based approaches. Most critically, to simulate fractures over a large area would mean to keep track of every line previously drawn, and for each line to potentially interact with all other lines - the cost of calculation would rocket exponentially.
Drawing lines on a fragment shader
Then, I thought of a way to draw lines directly on the GPU. I looked up Bresenham’s algorithm, which has been used to draw lines for decades. This algorithm essentially takes the line equation, puts in the current pixel’s \( x \) and \( y \) coordinates, and the line’s \( k \), and \( d \), and looks for where that classic equation holds true. If it does, the pixel is on the line.
$$ \begin{equation} y = k * x + d \end{equation} $$
The trouble with this method is that you have to express the line as a gradient dependent on \( x \), and not all lines can be expressed this way without flipping quadrants.
In school I learned another, more general, representation of a 2D line, which we called “Normalvektorform.” In English, this form is also known as “Hessian Normal Form”. Why use three words, when a single long word will do?
$$ \begin{equation} 0 = \vec{n} \cdot{X} - d\end{equation} $$
The equation above can be interpreted visually as follows: vector \( \vec{n} \) is a (unit) normal vector, perpendicular to our line, and the scalar \( d \) tells us how close the line passes by the origin.
Now, when drawing a line, each pixel will decide for itself if it can be part of the line or not: when the fragment shader executes, each pixel puts in its coordinate values for \( X \), and evaluates the line equation. If the equation returns 0, the pixel is bang on the line. If not, it gets a bit more interesting:
All pixels above the line will have a positive value, and all pixels below the line will have a negative value. This value will increase with the distance to the line, which makes it possible to draw the line as thick as we like.

How to simulate fractures with this method?
Well, the first step is already done. When we draw a line, we end up with the line, and the original shape split into two half-spaces.
How do we store the result? Simply by drawing the line. From the line equation above its clear that we only need 3 values to describe a line, \( x \) and \( y \) for the normal (normalized of course) and \( d \) for the distance to the origin. These are easily stored as an RGB color value. And what does the fragment shader do by design? It writes out a colour value. And that’s what we make it do: Each pixel writes out 0,0,0 which represents it either sitting on the line (black) - or it writes out a r,g,b colour value telling us whether it sits either above or below the line.
And this opens up a whole new field for experimentation…
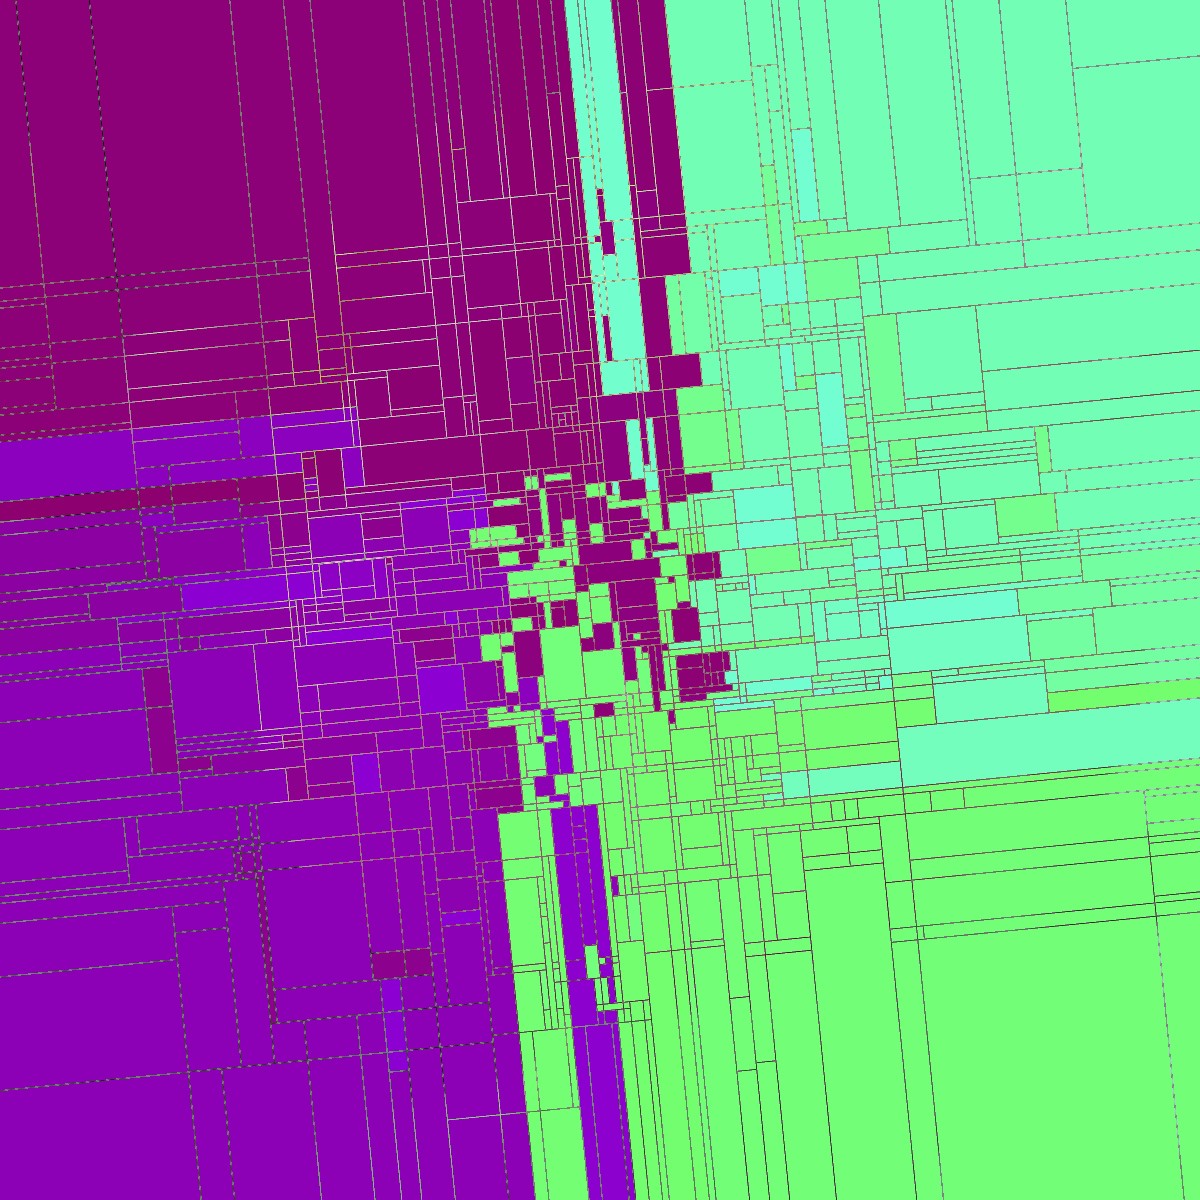
Because fractures are an iterative process, it makes sense at this point to think about what would happen if we applied a feedback loop. Once we have stored the result of our first run, we use that result as the start point for the next run.
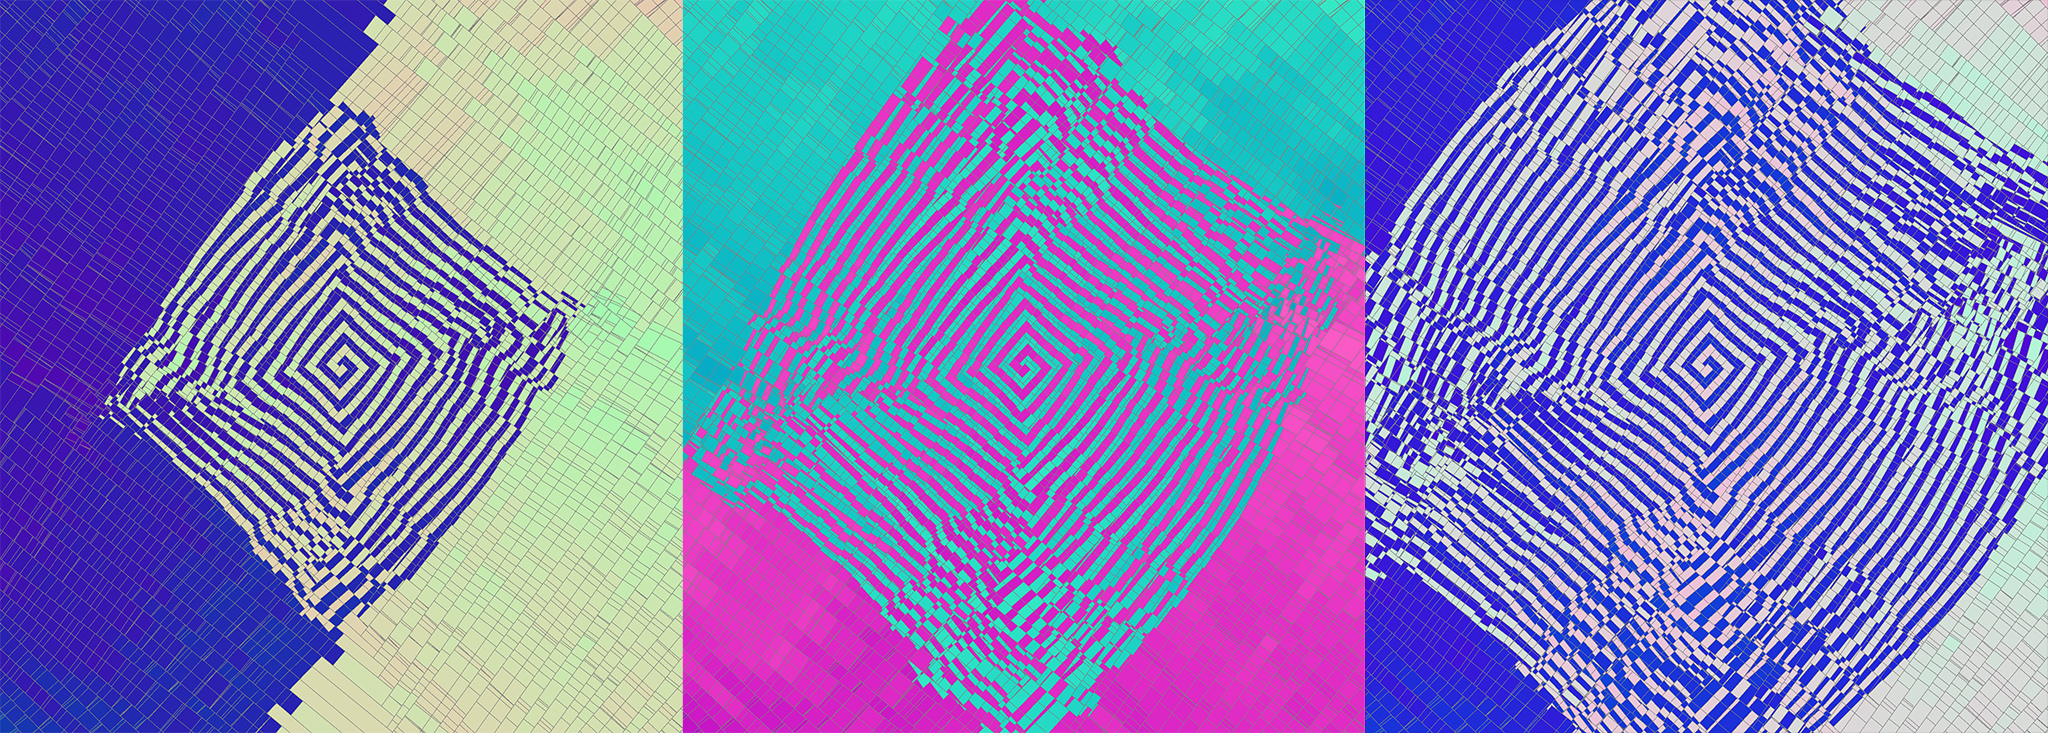
Different stages within a progressive feedback loop
How does this work? Well, let’s say: Each pixel first reads its previous color value to find out what line it will contribute to. From these RGB values, it can construct a line equation, and by evaluating this line equation, the pixel calculates whether it sits on that particular line or not.
If the pixel discovers it sits on its line, it turns black, and is done. Otherwise, the pixel will know whether it sits above or below its line. With this information, it can prepare for the next drawing iteration.
Let’s say all pixels above their line change their colour to represent a line equation for a line which is 90 degrees rotated from their original line, and pushed away slightly. And all pixels below their line do something similar, but rotated by 180 degrees. These colour values are then used for the next iteration.
Summary
The combination of feedback loops with per-pixel line equations stored in colour values opens up a promising field for exploration. Drawing more complex, curved lines would need more memory per-pixel, and could lead to a whole new class of visual experiments.
The method I describe is of course many steps removed from reality. Especially simulating the thickening of primary lines, lines which act like arteries on leaves, or main fracture lines in pottery, could be very rewarding.
Image Gallery
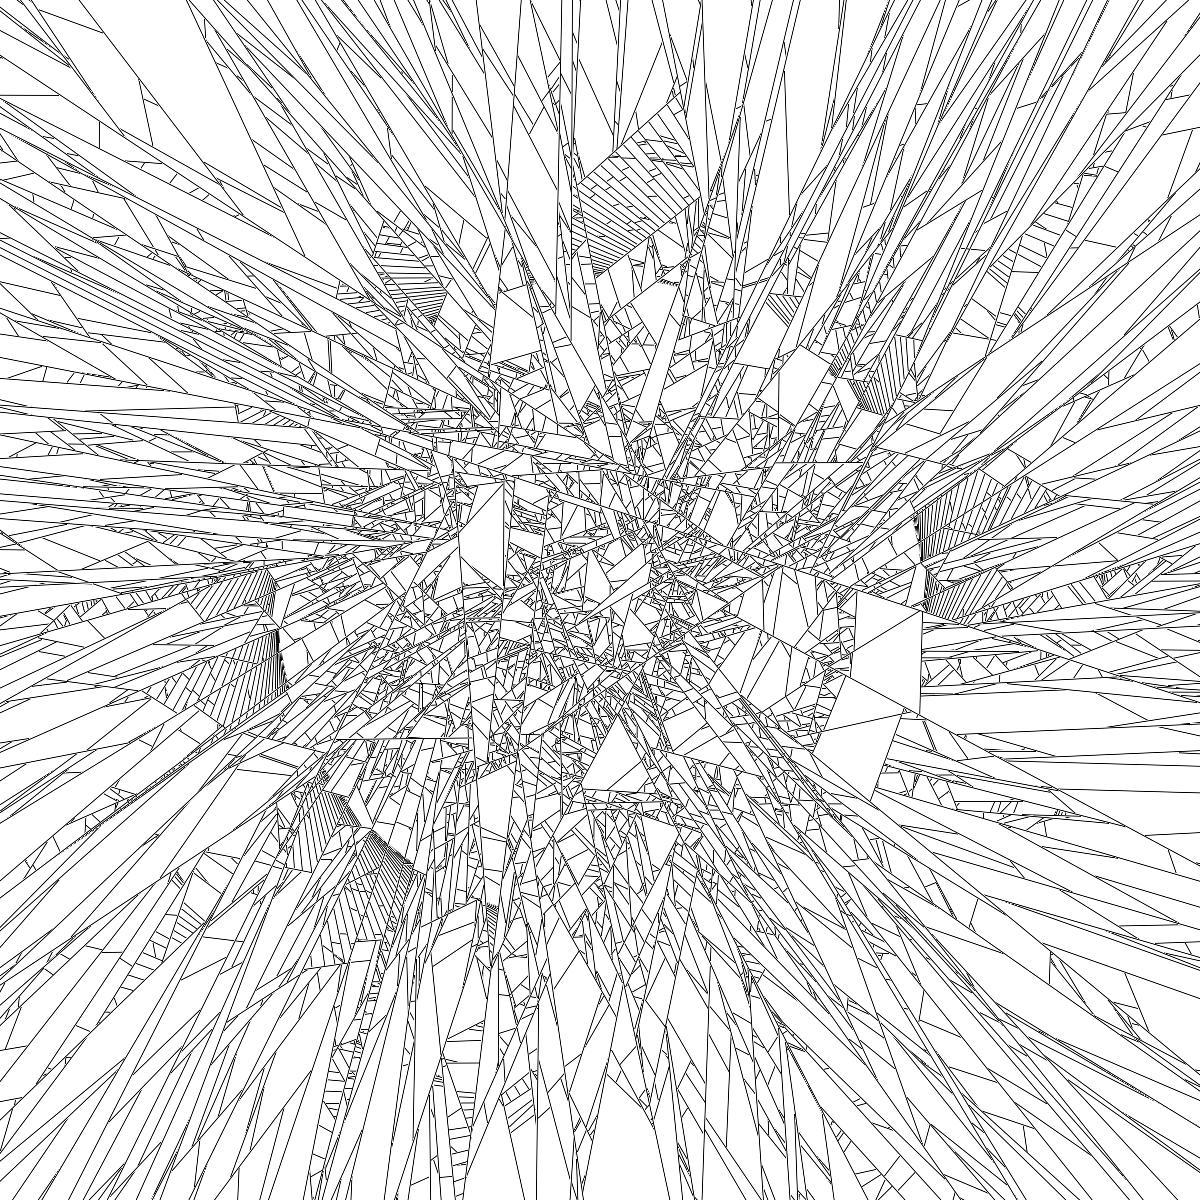
Here is a selection of some experiments I made so far, using straight lines:

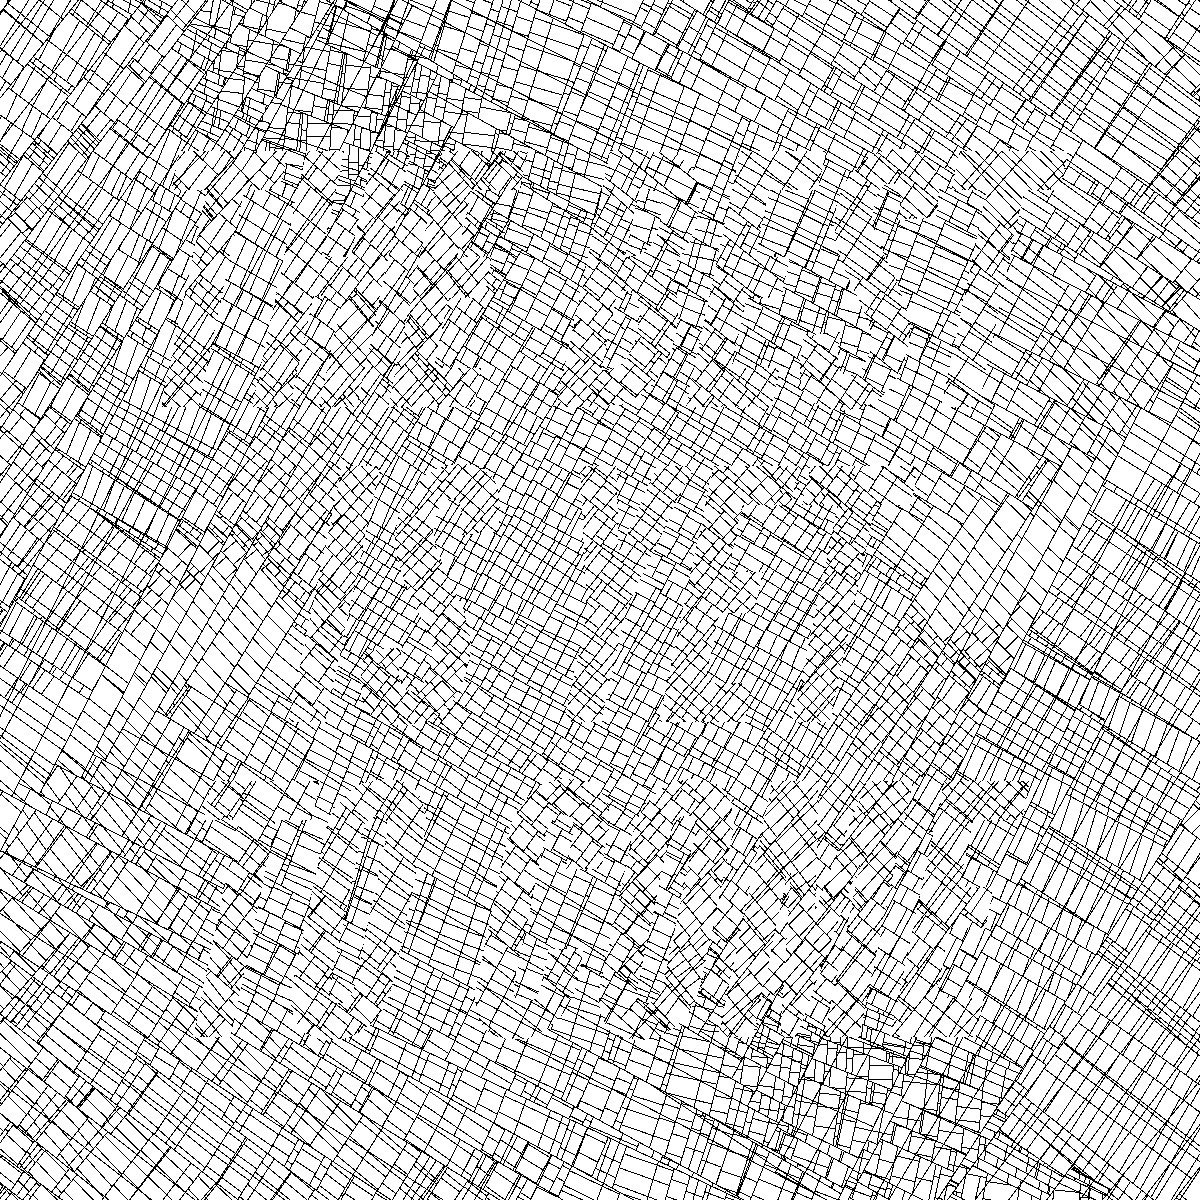
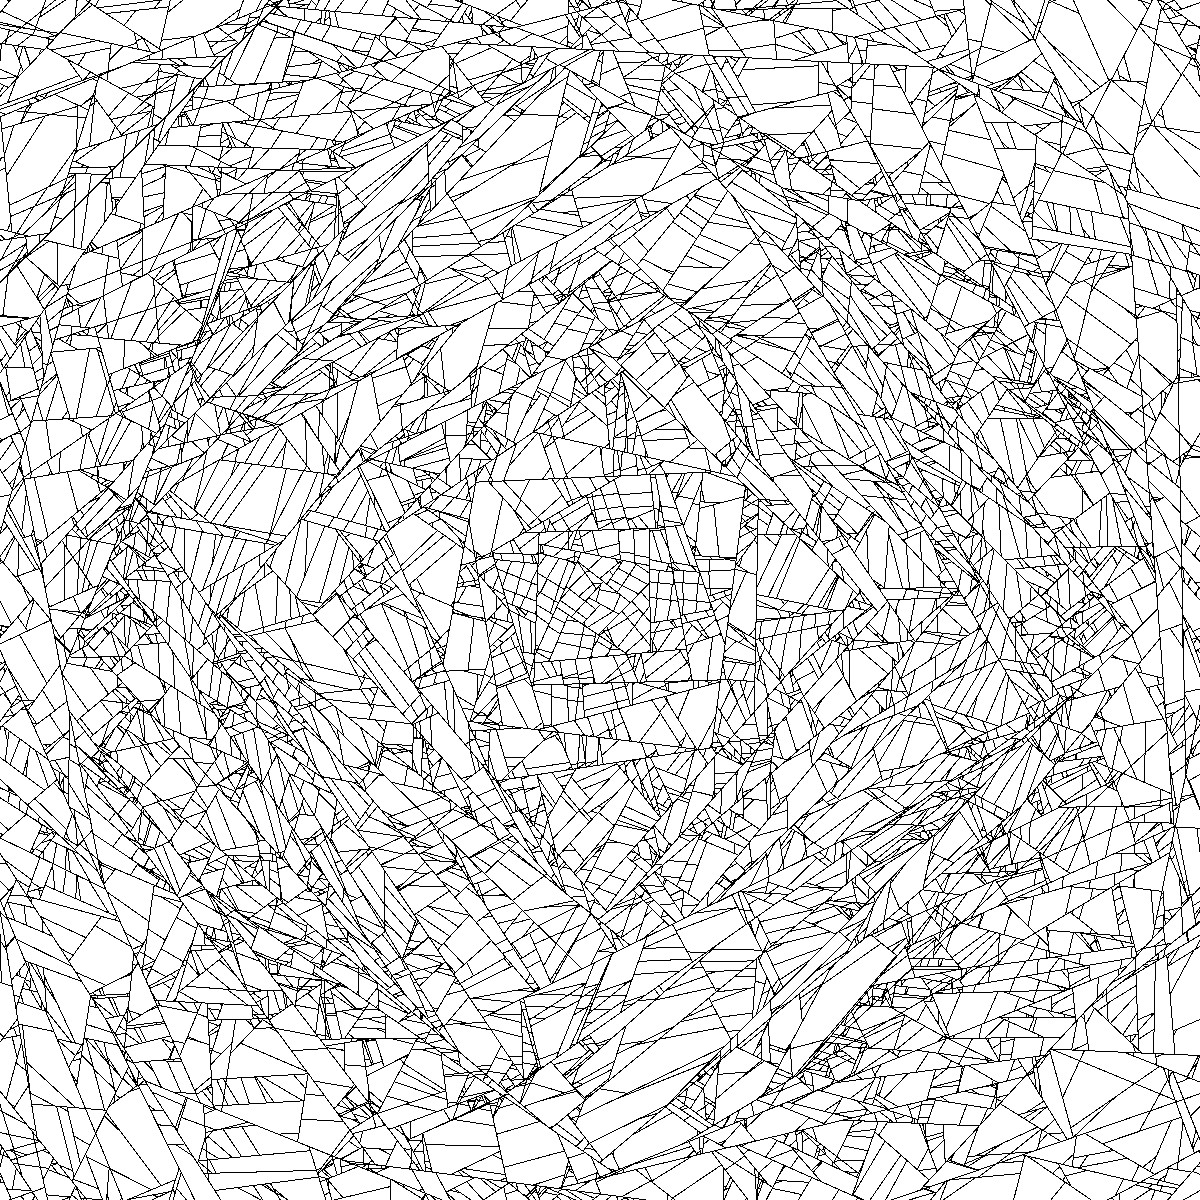
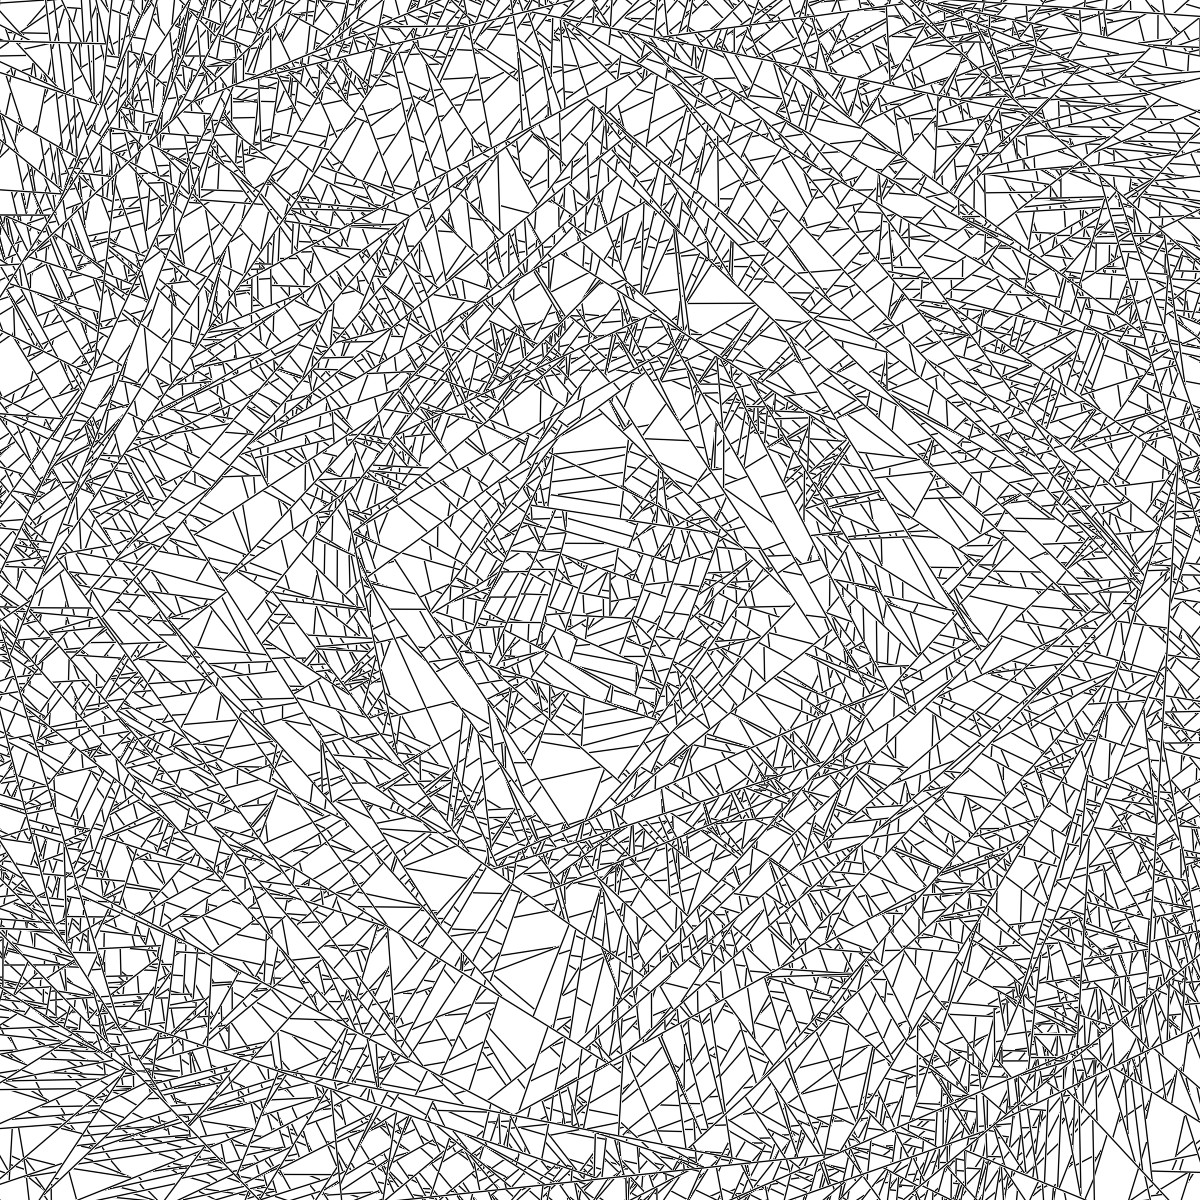
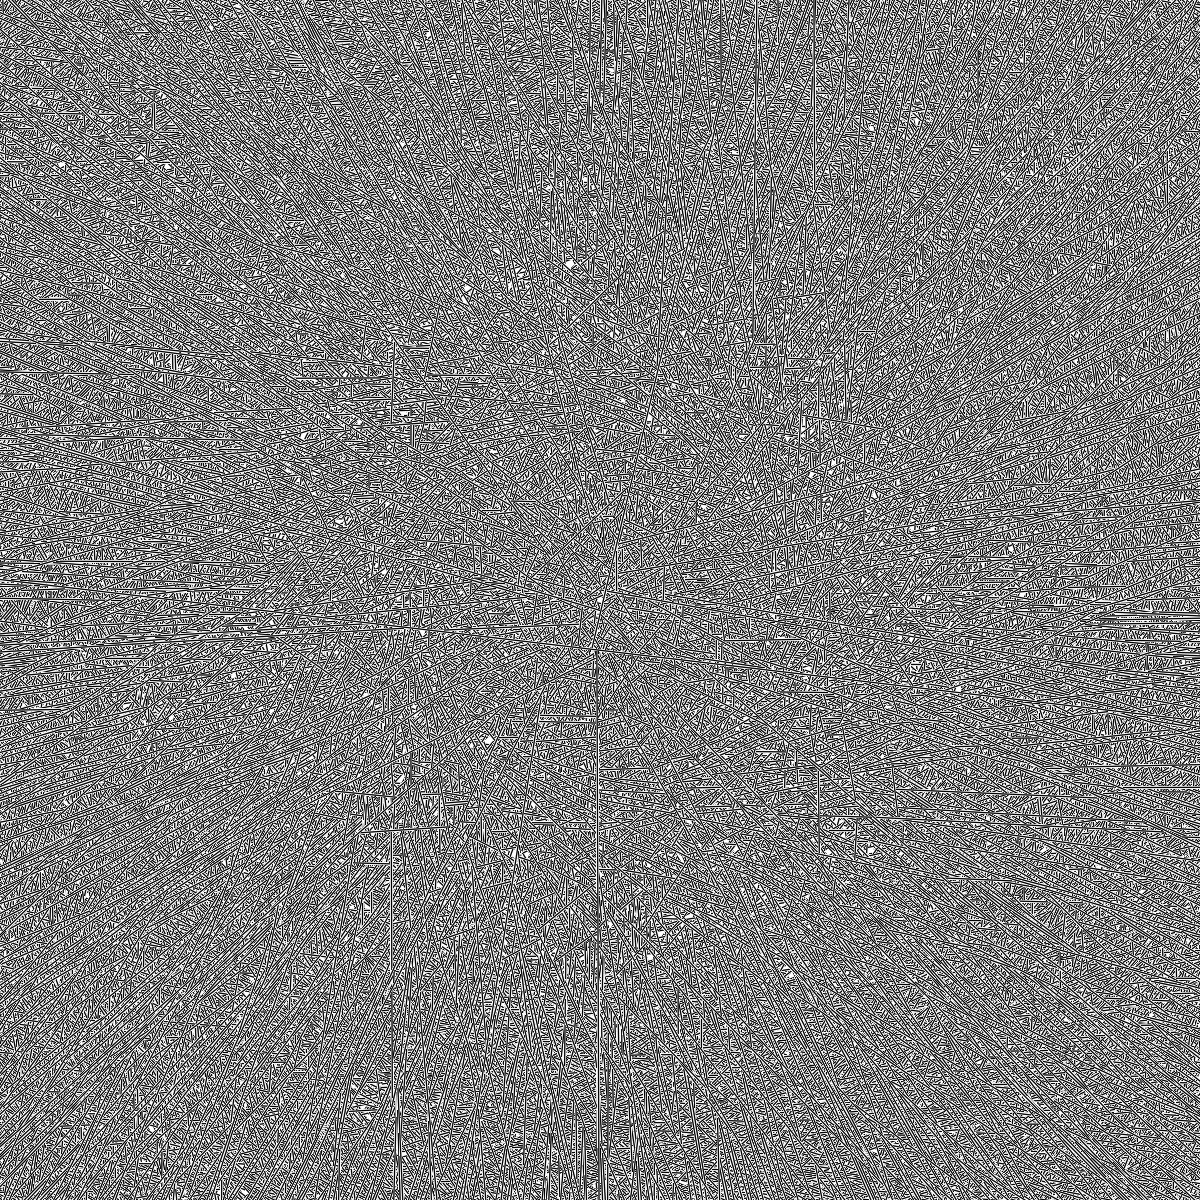
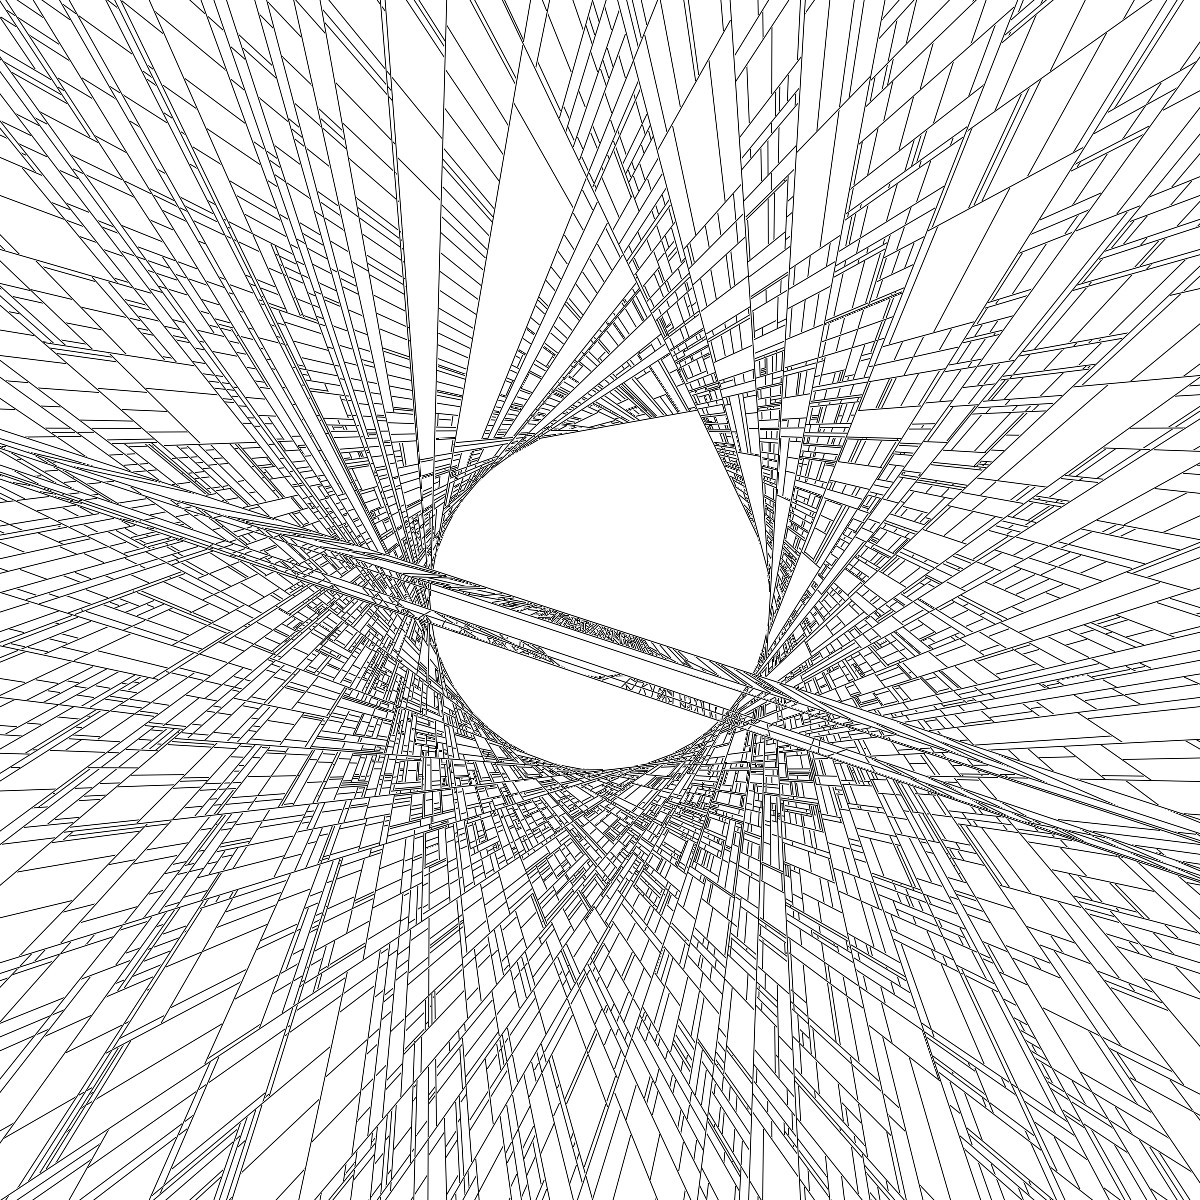
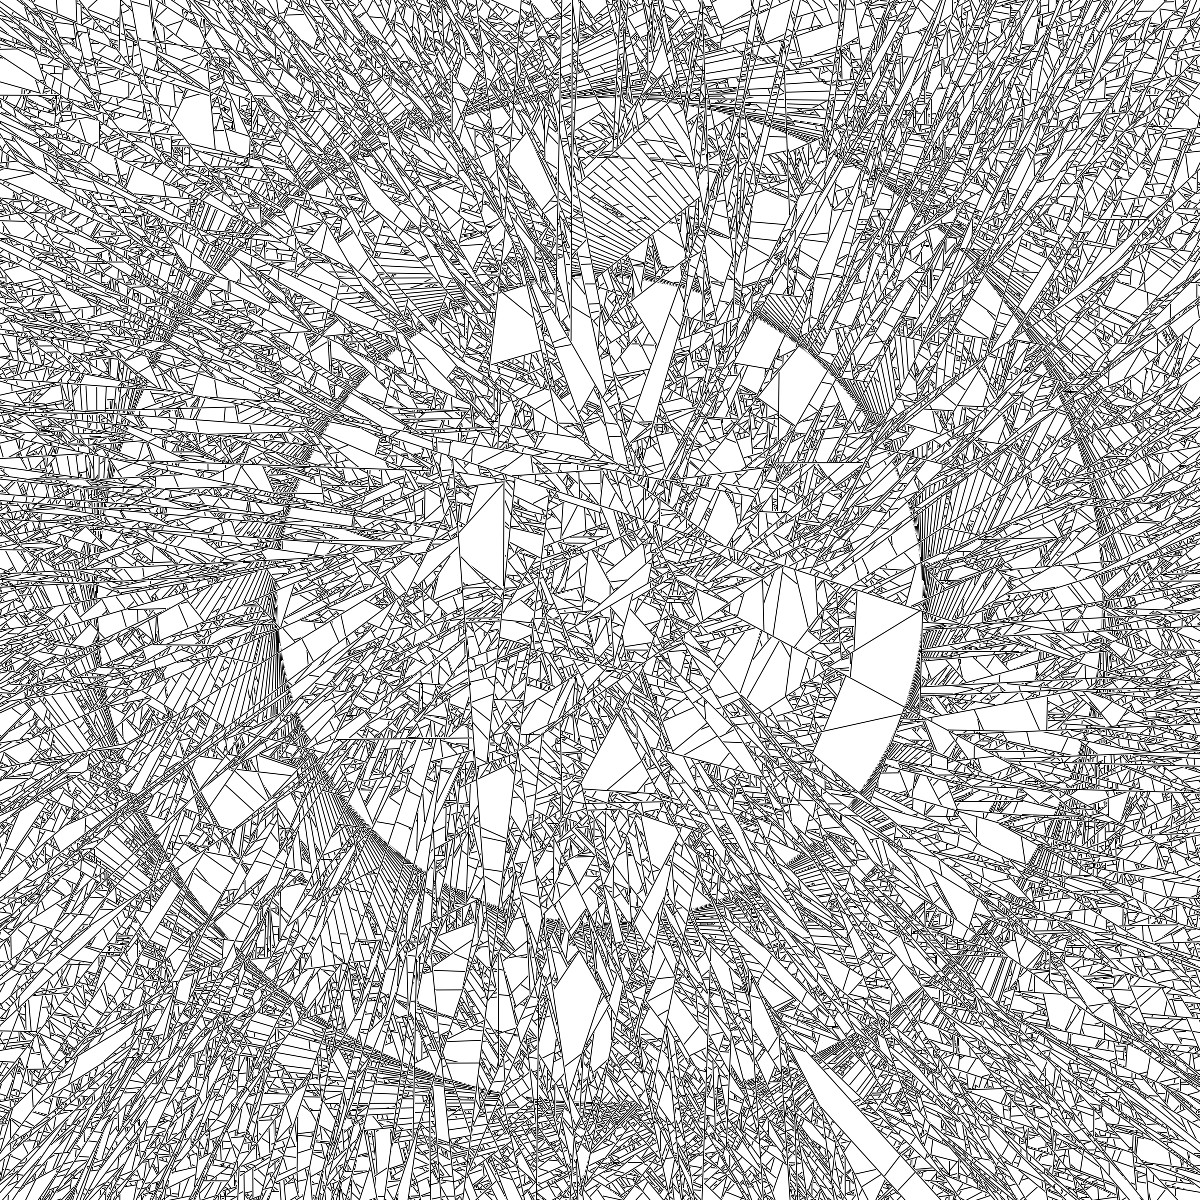
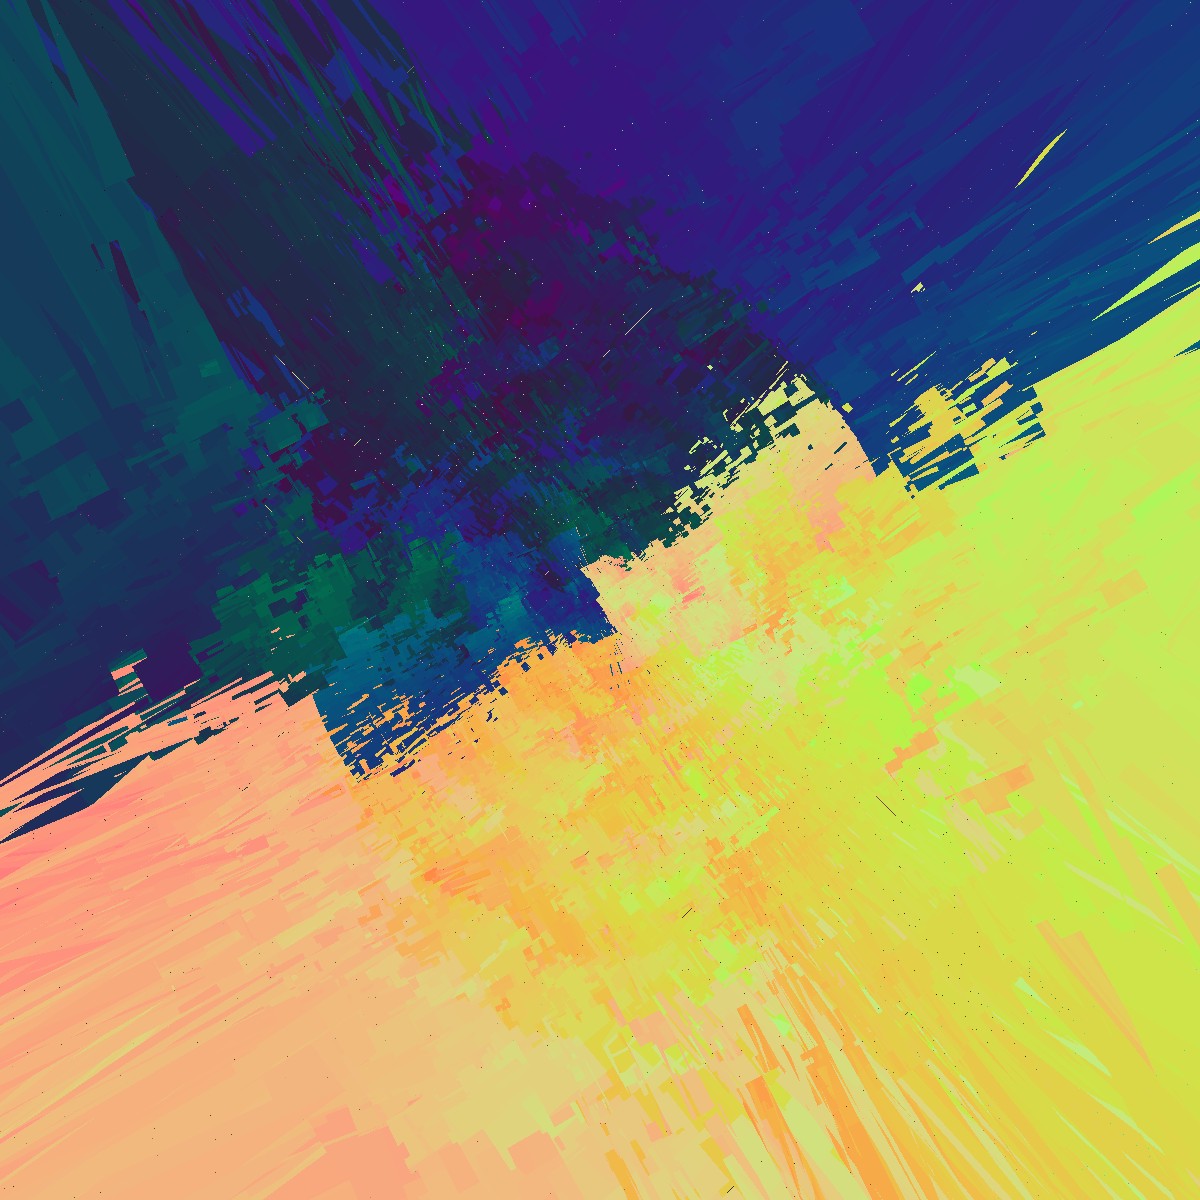
If you like to see more of these, take a look at my Instagram.
Tagged:
RSS:
Find out first about new posts by subscribing to the RSS Feed